After hearing about the blasts in London this morning, I thought I would give myself more time at the airport, figuring they would be on "heightened security", meaning longer waits.
I blew through faster than normal, and am now on-line, drinking coffee, and waiting for my plane, so maybe security isn't that heightened. Or maybe the regular security is so good that "heightened" doesn't mean anything. Or maybe it's because Thursday is the second slowest travel day of the week.

Window Manager - A (Now Retired) Executive Who has Nothing to do but Look out the Window
Thursday, July 07, 2005
Wednesday, July 06, 2005
I'm Old for a Blogger
MIT is running a blogging survey. Like any on-line survey where participants are self-selecting, there is an issue of how accurate the results are, but with over 50,000 people participating so far, my guess is that the results are statistically accurate.
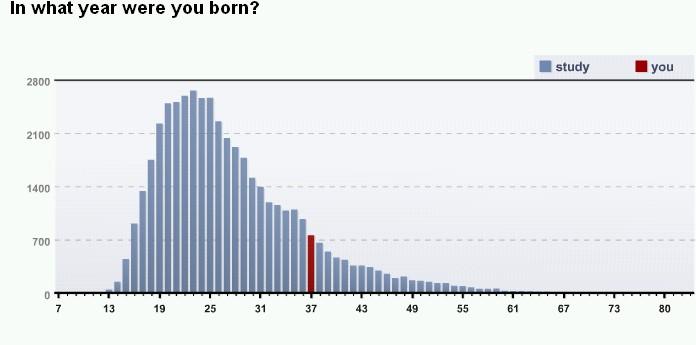
I thought the age distribution graph to date was interesting. When you re-log in to take a look at the results, it highlights your answer. So you can see in the graph below where I stick out as an old man in blogger land, although my guess is that all the "majors" are up there with me.

Click on the below to take the survey yourself.

I thought the age distribution graph to date was interesting. When you re-log in to take a look at the results, it highlights your answer. So you can see in the graph below where I stick out as an old man in blogger land, although my guess is that all the "majors" are up there with me.
Click on the below to take the survey yourself.
Tuesday, July 05, 2005
My Corporate Valuation Workbook
I'm really good at writing business plans. I can put together a slide set and related text showing why - from a marketing perspective - a certain idea should be funded, an acquisition take place, or a division spun out to stand on its own.
Unfortunately, "C-level" type executives also like to see a financial analysis to back up the pretty slides and marketing shtick, so I have had to develop - with help from others - what has become my standard financial model for corporate valuation. So, at the request of Dutch, I'll share an overview of what this looks like (I am taking the screen shots from a start-up that never got funded, so no proprietary data will show up).
First, the Excel workbook contains all the basic financial aspects of the enterprise, each having its own tab:


This spreadsheet evolved over several iterations, and I've been toting around the current version for about half a decade now. It's proven very valuable since it is a necessary part of writing a business plan.
Unfortunately, "C-level" type executives also like to see a financial analysis to back up the pretty slides and marketing shtick, so I have had to develop - with help from others - what has become my standard financial model for corporate valuation. So, at the request of Dutch, I'll share an overview of what this looks like (I am taking the screen shots from a start-up that never got funded, so no proprietary data will show up).
First, the Excel workbook contains all the basic financial aspects of the enterprise, each having its own tab:

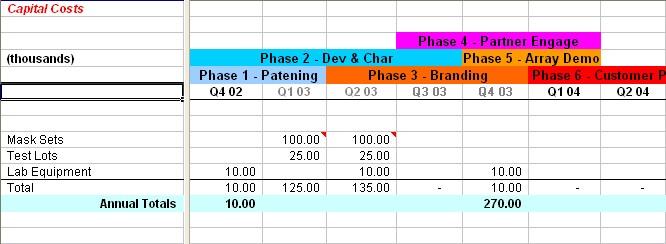
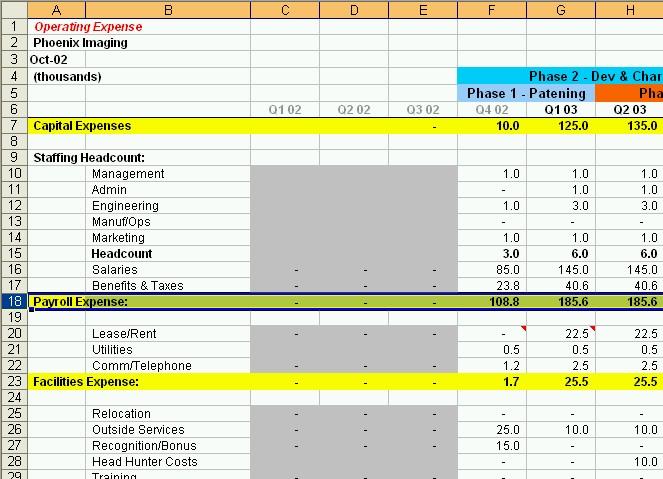
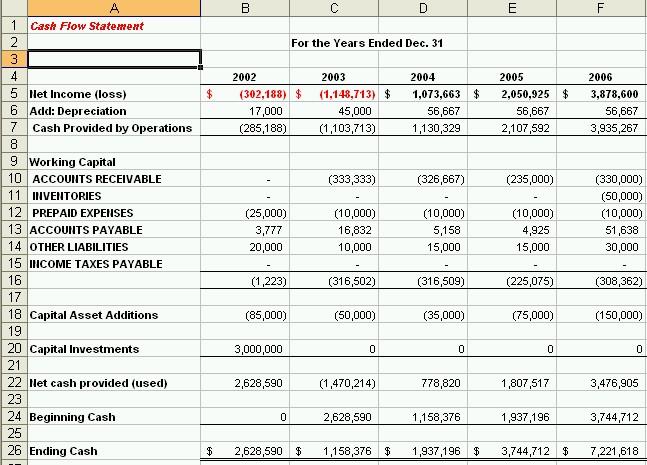
I am not going to bore you with screen shots of every tab, so let's just say that the sales tab is based on product volume and ASP, and that Cost of Goods Sold (COGS) is based on variable costs. Everything rolls up into the tabs that everybody really wants to see: income, cash flow and break-even:
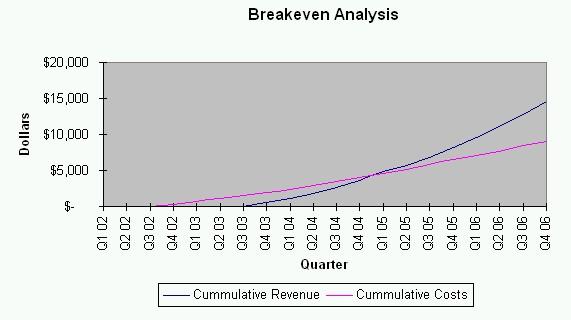
This spreadsheet evolved over several iterations, and I've been toting around the current version for about half a decade now. It's proven very valuable since it is a necessary part of writing a business plan.
Saturday, July 02, 2005
New Look or Old?
Reader Ed points out that Blogger fixed the problem with my old format - right after I spent a good deal of time getting the new layout to a point where I sort of like it.
So what will it be? Do you like the new look, or the old look, archived here?
So what will it be? Do you like the new look, or the old look, archived here?
Friday, July 01, 2005
My Job Opportunity Keeps Going Down with the Valuation
As noted previously I have been brought on as a consultant to help a due diligence team in an acquisition. The deal is that if the acquisition goes through, I will be brought on as a full time employee to run the new division.
That's quite a carrot to make the thing go through, but the catch is that I have to make the acquisition work after it's done. In other words, if I don't make the new division live up to the forecast I created for it during due diligence, my job will be short lived.
So the CFO and I have been batting the valuation for the "acquiree" back and forth for the last few days. My number started off high, being the optimistic marketing guy that I am. His number started off low, being the pessimistic bean counter that he is. The problem is that as we went through the differences in our models, he convinced me to take his side a lot more than I convinced him to take mine.
So the valuation keeps going down with each revision (we are now on "E"). That is normally a good thing since this means the price of the company - and thus the acquisition cost - keeps going down, but the problem now is that the latest revision valuates the company lower than the last round put into it by the VCs. In other words, we are at a valuation that is lower than what the investors put into the company.
Now this includes only one aspect of the company: the net present value of future cash flows (NPV). This leaves out of the calculation certain assets on the company's balance sheet that we would jettison, cash on hand, and other items that would actually increase a negotiated sales price.
So maybe it's not a lost cause, but I think the probability of the acquisition going through - and my permanent job prospects with this company - went down with each revision of the spreadsheet.
That's quite a carrot to make the thing go through, but the catch is that I have to make the acquisition work after it's done. In other words, if I don't make the new division live up to the forecast I created for it during due diligence, my job will be short lived.
So the CFO and I have been batting the valuation for the "acquiree" back and forth for the last few days. My number started off high, being the optimistic marketing guy that I am. His number started off low, being the pessimistic bean counter that he is. The problem is that as we went through the differences in our models, he convinced me to take his side a lot more than I convinced him to take mine.
So the valuation keeps going down with each revision (we are now on "E"). That is normally a good thing since this means the price of the company - and thus the acquisition cost - keeps going down, but the problem now is that the latest revision valuates the company lower than the last round put into it by the VCs. In other words, we are at a valuation that is lower than what the investors put into the company.
Now this includes only one aspect of the company: the net present value of future cash flows (NPV). This leaves out of the calculation certain assets on the company's balance sheet that we would jettison, cash on hand, and other items that would actually increase a negotiated sales price.
So maybe it's not a lost cause, but I think the probability of the acquisition going through - and my permanent job prospects with this company - went down with each revision of the spreadsheet.
Subscribe to:
Posts (Atom)