

Likewise if there is no money in the economy, the chances of money "trickling down" to my product are lower (the economy could do well and our major segments not, but this is just a general model which I would then break out any segment specific issues). So using this model, I do an analysis using the following steps:
Step 1 - U.S. Economic Picture
In order to get a U.S. forecast I track ten U.S. economic indicators on a monthly basis. There are a variety of places for these, but one site that has good historical data is Neat Ideas. I am not going to list all of them, but there are the "big two" which are posted and commented on incessantly by the mainstream press: GDP and unemployment.

There is no doubt the U.S. economy is growing, with 4Q03 estimates on the order of 4%, which makes it surprising that we have fools like Gephardt saying this is the "worst economy since the depression". The reason that he can get away with some of this rhetoric is the unemployment picture, which hasn't kept up with economic growth.
There have been a variety of explanations for this issue ranging from the fact the unemployment is a lagging indicator to the issue of structural changes in manufacturing. However, I think the next two graphs provide some good insight on the issue. The first shows that U.S. industrial output is picking up. The second explains why unemployment is still lagging: productivity - the amount of goods output over labor input, has skyrocketed recently, meaning that businesses have increased output while holding labor steady.

While there has been sideways movement of manufacturing, it is up significantly over the last few quarters, along with an increase in productivity. The question is: how long can businesses keep up this productivity increase? The answer to this question indicates when hiring will start significantly improving.
Based on the other six indicators I track and other forecasts, I estimate that the hiring picture will improve significantly in the 2Q of 2004, just in time for the elections.
Step 2 - My Company's Major Industries
My Company participates in the high-tech field, but its major markets are Personal Computers (PCs), cellphones and consumer electronics. While these products by and large are not manufactured in the U.S., purchasing decisions, pricing and purchasing volumes are made here. In addition, the U.S. is one of the largest markets for these products, so tracking the U.S. demand will point to where these segments are going.
In the PC market, consensus estimates all have the market seeing a recovery this year with several years of volume growth being forecasted.

In the cellphone market, after a flat two years after the 2001 implosion, forecasts keep being revised upward every several months"

The other area I look at is the electronics supply chain, which includes semiconductors ("computer chips") and printed circuit boards (PCBs). Both have shown dramatic improvement lately in their Book to Bill (BB) ratios, which is the ratio of new orders over shipments. Anything over 1.0 means that companies are seeing more orders than they are currently shipping.
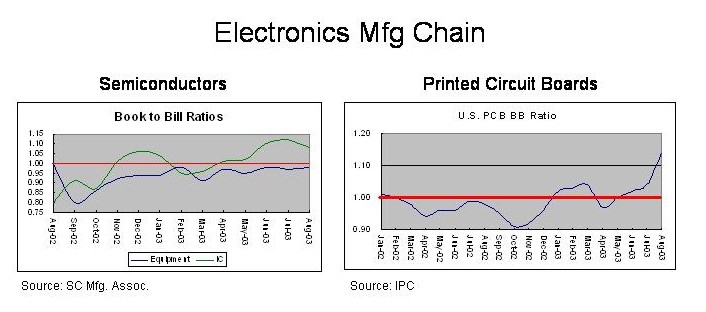
The only indicator lagging is semiconductor equipment, meaning that capacity in the manufacturing plants ("fabs") are still not 100%. Estimates of capacity utilization are currently 80% and a continued improvement in semiconductor production should raise the equipment BB above 1 in the first part of next year.
Step 3 - My Company's Products
The next step I take is to look at data for my Company's particular products (I actually try to do a full Porter Model which analyzes all aspects of my industry, but I am trying to keep this posting somewhat brief).
For my particular products, I have already seen great improvement in volume demand based on the upswing in the markets I outlined above. The one area which has prevented my company from improving it's top line is Average Sales Price (ASP), which has seen significant erosion over the past two years.
However, the tide seems to be turning there as well. As volume increases in the above segments and manufacturing capacity tightens at my Company and its competitors, I have seen all our major customers scrambling to lock in long-term volume contracts, meaning they are locking in pricing

In addition, in my particular market and in some associated markets, there have been areas of spot shortages, which is probably another reason purchasing managers are looking to lock in contracts.
Step 4 - Conclusions
Based on this analysis, I have provided the following conclusions to my Masters:
1. The U.S. economy is growing. Growth will continue accelerate in 2004 and employment will start showing significant improvement by the second quarter.
2. All Major Markets that we participate in are showing volume growth and will continue to have growth in 2004.
3. ASPs, which have been the weak point in growing our top line revenue so far in 2003, are stabilizing due to tightening of manufacturing capacity in our market. This fact means that we should be able to grow both volume and revenue in 2004
4. Based on these conclusions, both expansion and hiring should be planned for the coming fiscal year.
Step 5 - Personal Conclusions
The above analysis is a part of my job, which I am judged on, so the analysis was done as impartially as possible since a huge screw-up will likely make me an unemployed Window Manager.
Based on what I see, however, I don't see the economy being a big stick for the democrats in next year's election. There are certainly other issues which Bush will be weak, but the economy - probably the biggest issue for the out-of-power party - won't be a large factor.
No comments:
Post a Comment