
Unfortunately, "C-level" type executives also like to see a financial analysis to back up the pretty slides and marketing shtick, so I have had to develop - with help from others - what has become my standard financial model for corporate valuation. So, at the request of Dutch, I'll share an overview of what this looks like (I am taking the screen shots from a start-up that never got funded, so no proprietary data will show up).
First, the Excel workbook contains all the basic financial aspects of the enterprise, each having its own tab:
 These are all linked together, so a change in, say, average sales price (ASP), cascades through the workbook and shows up the cashflow, income statement and breakeven tabs, so "what-if" analyses are easily done on the fly.
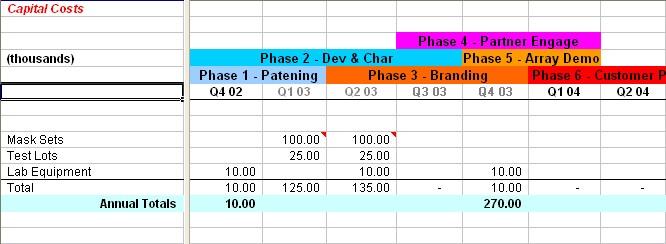 The spreadsheet is broken down by quarters throughout the analysis, with yearly roll-ups provided as needed. As seen here in the Capital Costs sheet, there is not a lot of detail in some of the headings, so I usually add additional sheets that provide a full breakdown, and link the sum into this sheet. I also usually tie the spreadsheet into any written analysis I have done, which is why in this example you see "phases", which were outlined in the written business case.
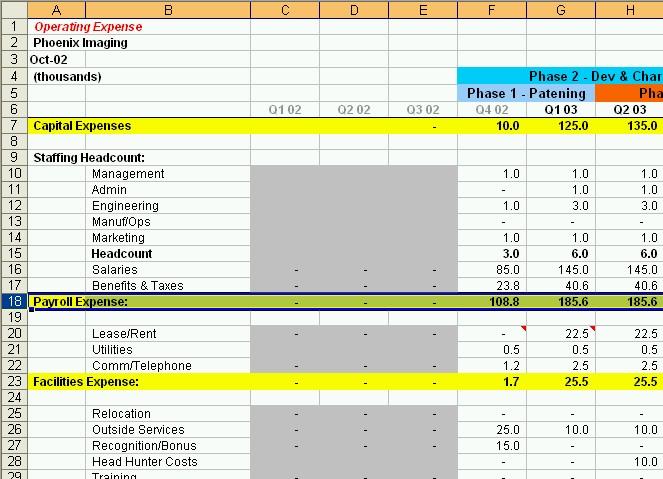 The Operating Expense sheet has proven pretty valuable since most people don't consider a lot of the little things that add up while running a business: postage, long distance, consultants like me. In most of my spreadsheets (although not this one) most of the operating charges are based on headcount, so changing headcount changes not only the salary line, but all other expenses for the business, such as required square footage.
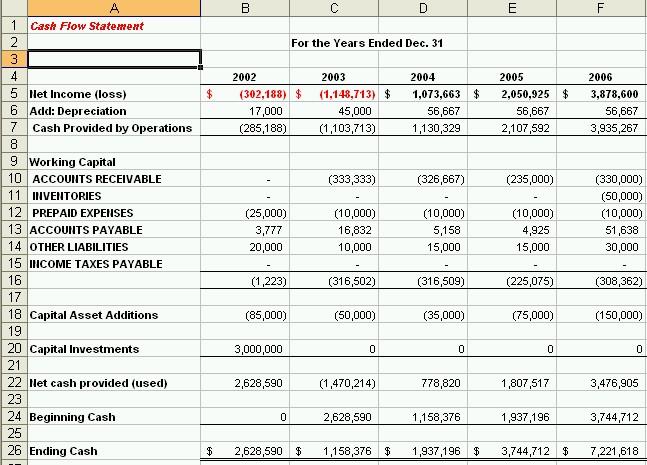
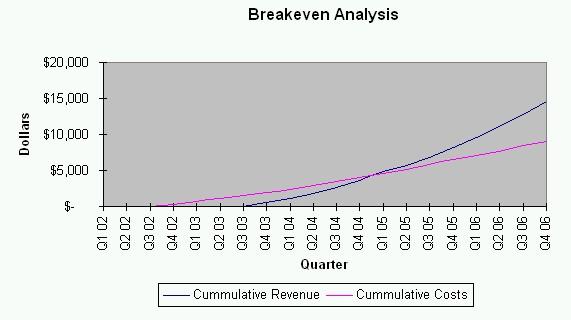
I am not going to bore you with screen shots of every tab, so let's just say that the sales tab is based on product volume and ASP, and that Cost of Goods Sold (COGS) is based on variable costs. Everything rolls up into the tabs that everybody really wants to see: income, cash flow and break-even:
This spreadsheet evolved over several iterations, and I've been toting around the current version for about half a decade now. It's proven very valuable since it is a necessary part of writing a business plan.
No comments:
Post a Comment